
01 Jun 2026 · Data Engineering, Spark
Fabric Spark Pool Optimiser: Stop Paying for a 40-Ton Truck to Deliver a Letter
An open-source notebook that analyses your real Spark session history and tells you exactly which workspace pools are oversized.
Fabric Spark Pool Optimiser — analyses real Spark session data across your Fabric workspaces and recommends the optimal Spark pool configuration.
- Microsoft Fabric Community post: Fabric Spark Pool Optimiser
- GitHub:
enekoegiguren/fabricsparkpooloptimiser
The problem: every workspace runs the same default pool
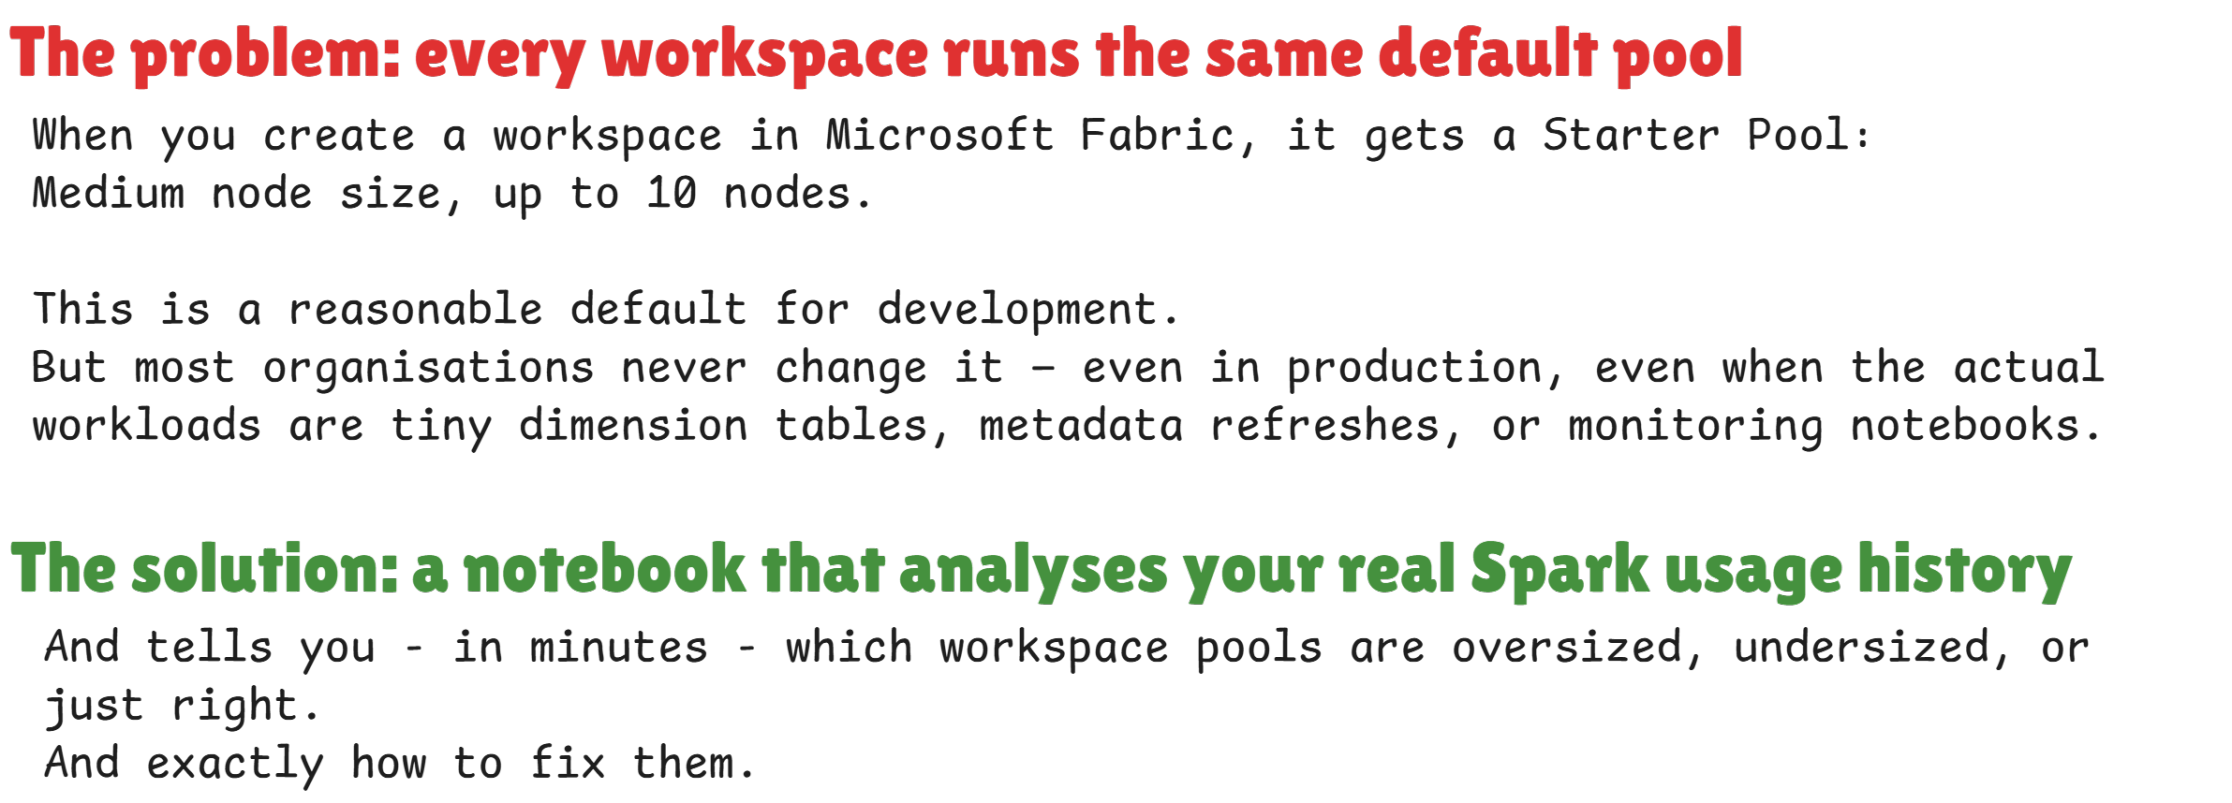
When you create a workspace in Microsoft Fabric, it gets a Starter Pool: Medium node size, up to 10 nodes.
This is a reasonable default for development. But most organisations never change it — even in production, even when the actual workloads are tiny dimension tables, metadata refreshes, or monitoring notebooks.
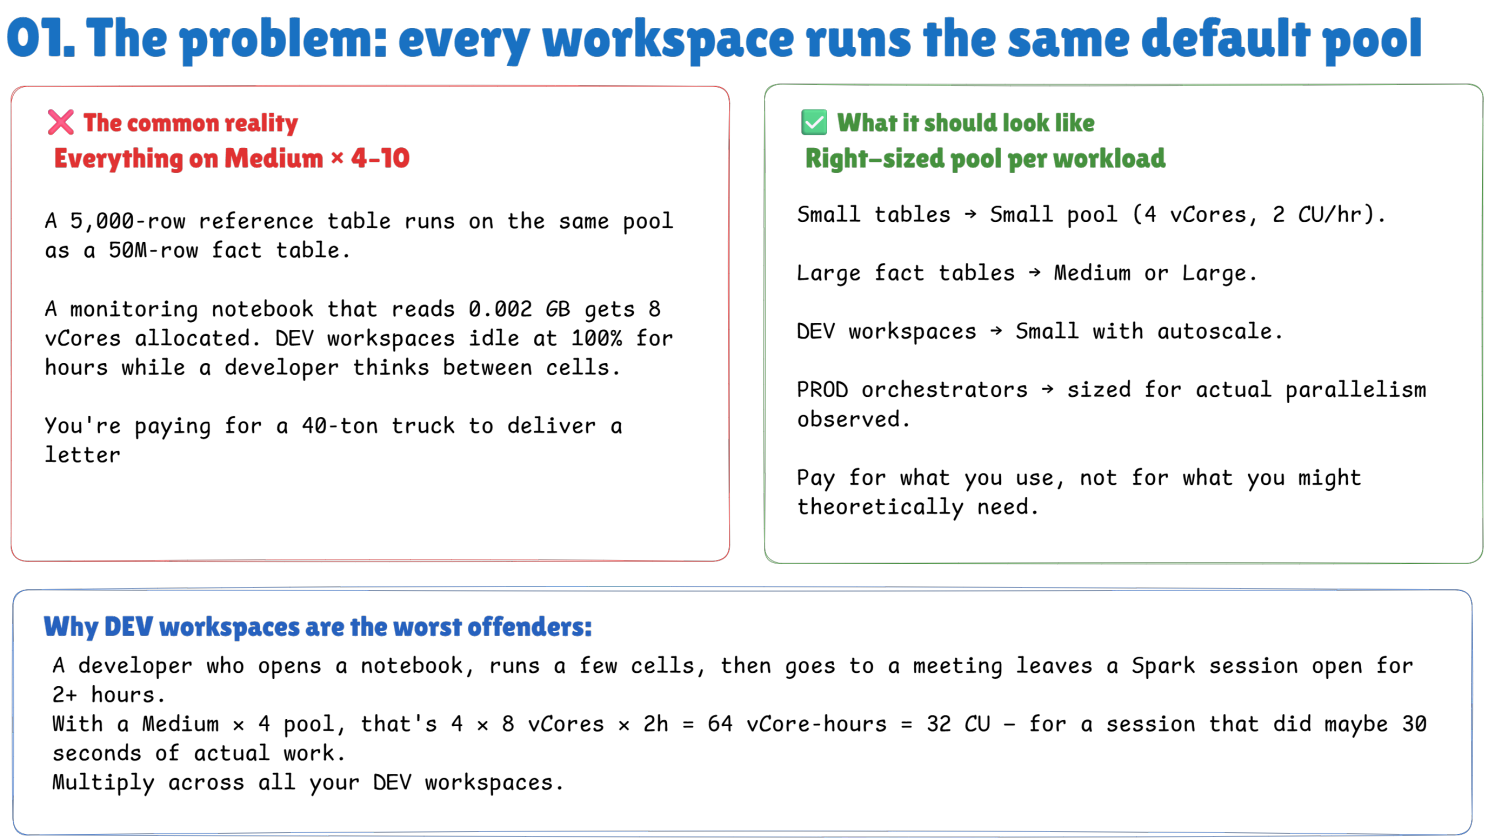
The common reality: a 5,000-row reference table runs on the same pool as a 50M-row fact table. A monitoring notebook that reads 0.002 GB gets 8 vCores allocated. DEV workspaces idle at 100% for hours while a developer thinks between cells. You’re paying for a 40-ton truck to deliver a letter.
What it should look like: small tables get a small pool (4 vCores, 2 CU/hr). Large fact tables get Medium or Large. DEV workspaces get Small with autoscale. PROD orchestrators get sized for the actual parallelism observed. Pay for what you use, not for what you might theoretically need.
Why DEV workspaces are the worst offenders: a developer who opens a notebook, runs a few cells, then goes to a meeting leaves a Spark session open for 2+ hours. With a Medium × 4 pool, that’s 4 × 8 vCores × 2h = 64 vCore-hours = 32 CU — for a session that did maybe 30 seconds of actual work. Multiply across all your DEV workspaces.
Understanding Fabric’s Spark pool architecture
Before explaining how the optimiser works, it’s important to understand how Fabric allocates compute — because this is what makes the default Medium × 4 pool so costly at scale.
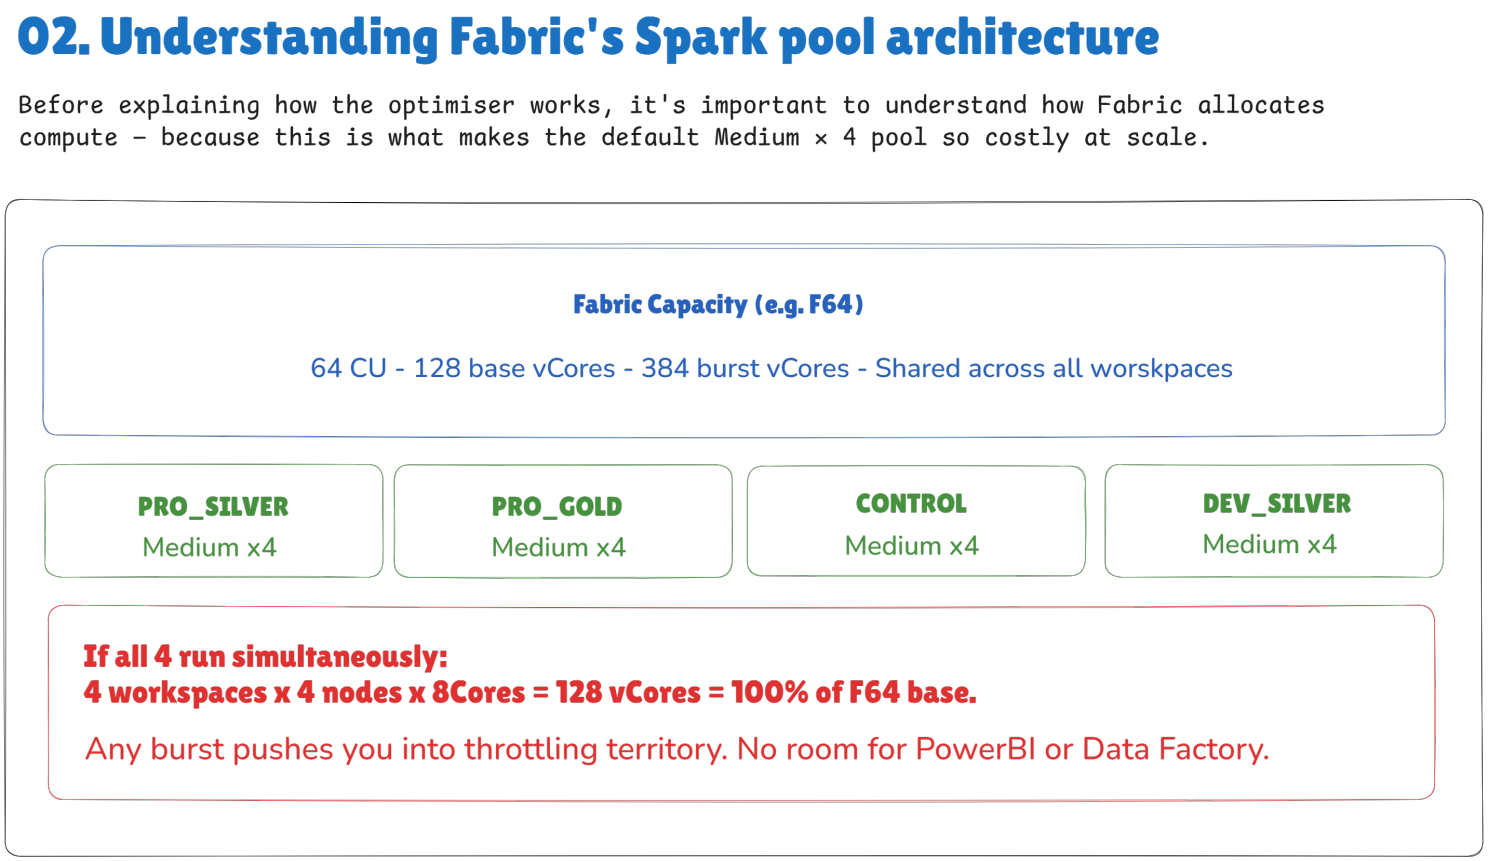
A Fabric capacity — an F64, for example — has 64 CU, 128 base vCores, and 384 burst vCores, shared across every workspace on it. If four workspaces (say PRO_SILVER, PRO_GOLD, CONTROL, DEV_SILVER) all run the default Medium × 4 pool simultaneously, that’s 4 workspaces × 4 nodes × 8 cores = 128 vCores — 100% of the F64 base. Any burst pushes you into throttling territory, with no room left for Power BI or Data Factory.
This started with a video
Patrick LeBlanc and Just Blindbaek’s session “Understanding Spark Pools, Capacity, and Notebooks in Microsoft Fabric” on Fabric Tech Talk Fridays made me look at our pools properly for the first time.
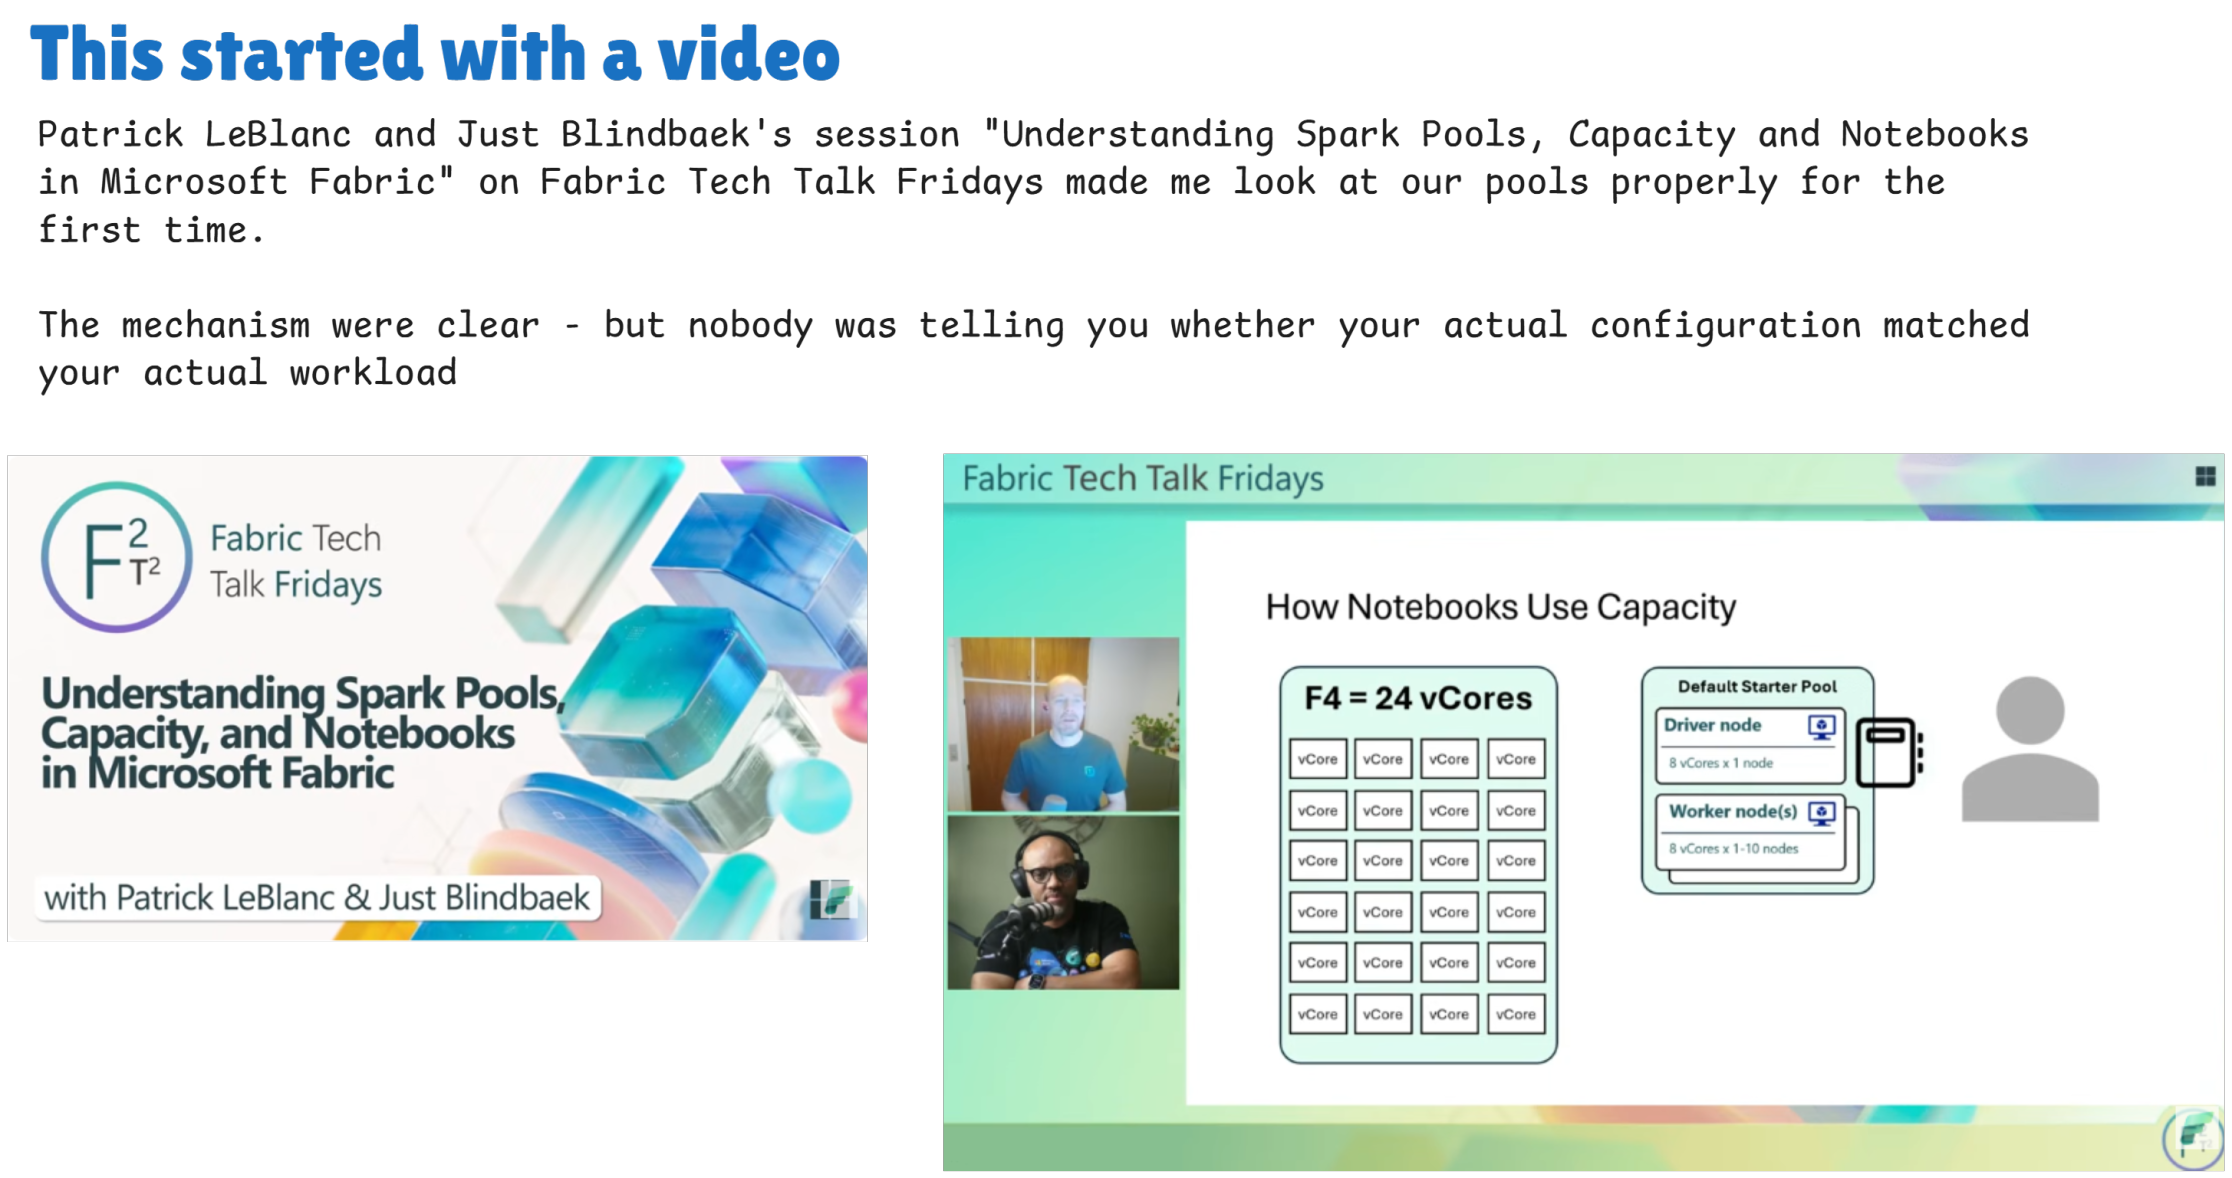
The mechanics were clear — but nobody was telling you whether your actual configuration matched your actual workload.
And while I was building this, Microsoft announced something relevant
Just this week, Fabric launched Resource Profiles in Preview — preconfigured compute profiles for Data Engineering workloads.
The idea is simple: instead of manually tuning dozens of Spark properties, you declare what your notebook is doing (write-heavy, read-heavy for Spark, read-heavy for Power BI) and Fabric applies the optimal configuration automatically.
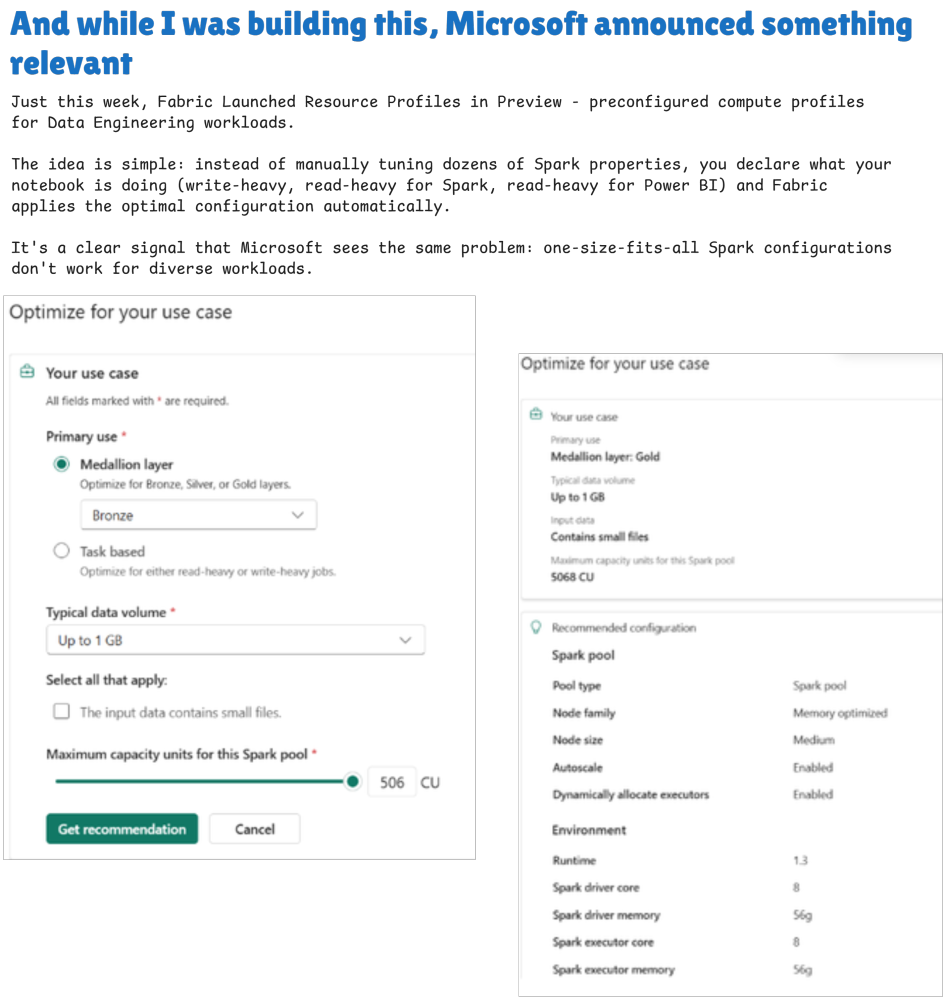
It’s a clear signal that Microsoft sees the same problem: one-size-fits-all Spark configurations don’t work for diverse workloads. Resource Profiles helps you configure a new pool sensibly — the Optimiser is complementary: it tells you what’s actually happening on the pools you already have.
Getting started in 3 steps
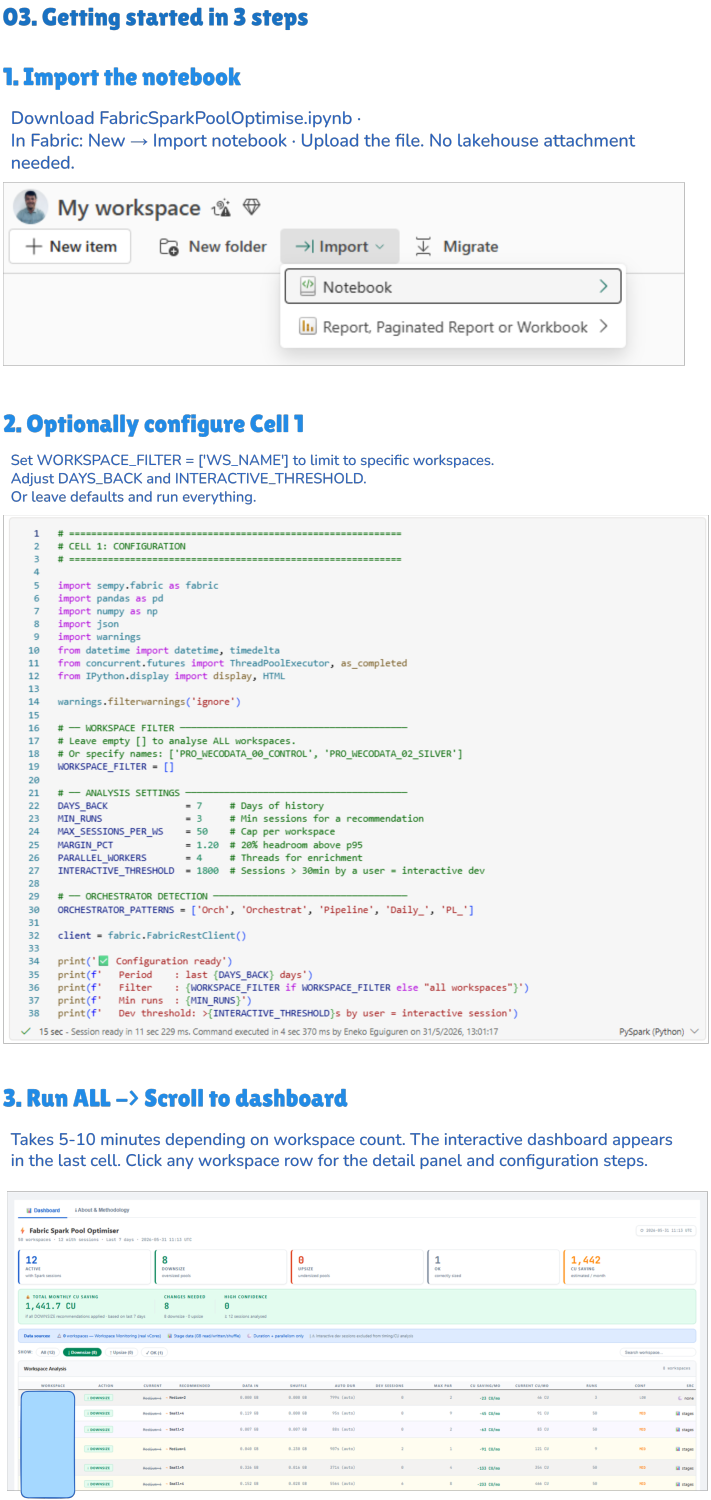
1. Import the notebook. Download FabricSparkPoolOptimise.ipynb. In Fabric: New → Import → Notebook. Upload the file. No lakehouse attachment needed.
2. Optionally configure Cell 1. Set WORKSPACE_FILTER = ['WS_NAME'] to limit the analysis to specific workspaces. Adjust DAYS_BACK and INTERACTIVE_THRESHOLD, or leave the defaults and run everything:
# =====================================================
# CELL 1: CONFIGURATION
# =====================================================

import sempy.fabric as fabric
import pandas as pd
import numpy as np
import json
import warnings
from datetime import datetime, timedelta
from concurrent.futures import ThreadPoolExecutor, as_completed
from IPython.display import display, HTML

warnings.filterwarnings('ignore')

# --- WORKSPACE FILTER -------------------------------
# Leave empty [] to analyse ALL workspaces.
# Or specify names: ['PRO_WECODATA_00_CONTROL', 'PRO_WECODATA_02_SILVER']
WORKSPACE_FILTER = []

# --- ANALYSIS SETTINGS -------------------------------
DAYS_BACK             = 7     # Days of history
MIN_RUNS              = 3     # Min sessions for a recommendation
MAX_SESSIONS_PER_WS   = 50    # Cap per workspace
MARGIN_PCT            = 1.20  # 20% headroom above p95
PARALLEL_WORKERS      = 4     # Threads for enrichment
INTERACTIVE_THRESHOLD = 1800  # Sessions > 30min by a user = interactive dev

# --- ORCHESTRATOR DETECTION ---------------------------
ORCHESTRATOR_PATTERNS = ['Orch', 'Orchestrat', 'Pipeline', 'Daily_', 'PL_']

client = fabric.FabricRestClient()

print('Configuration ready')
print(f'  Period   : last {DAYS_BACK} days')
print(f'  Filter   : {WORKSPACE_FILTER if WORKSPACE_FILTER else "all workspaces"}')
print(f'  Min runs : {MIN_RUNS}')
print(f'  Dev threshold: >{INTERACTIVE_THRESHOLD}s by user = interactive session')
3. Run All → scroll to dashboard. Takes 5–10 minutes depending on workspace count. The interactive dashboard appears in the last cell. Click any workspace row for the detail panel and configuration steps.
How the optimiser works
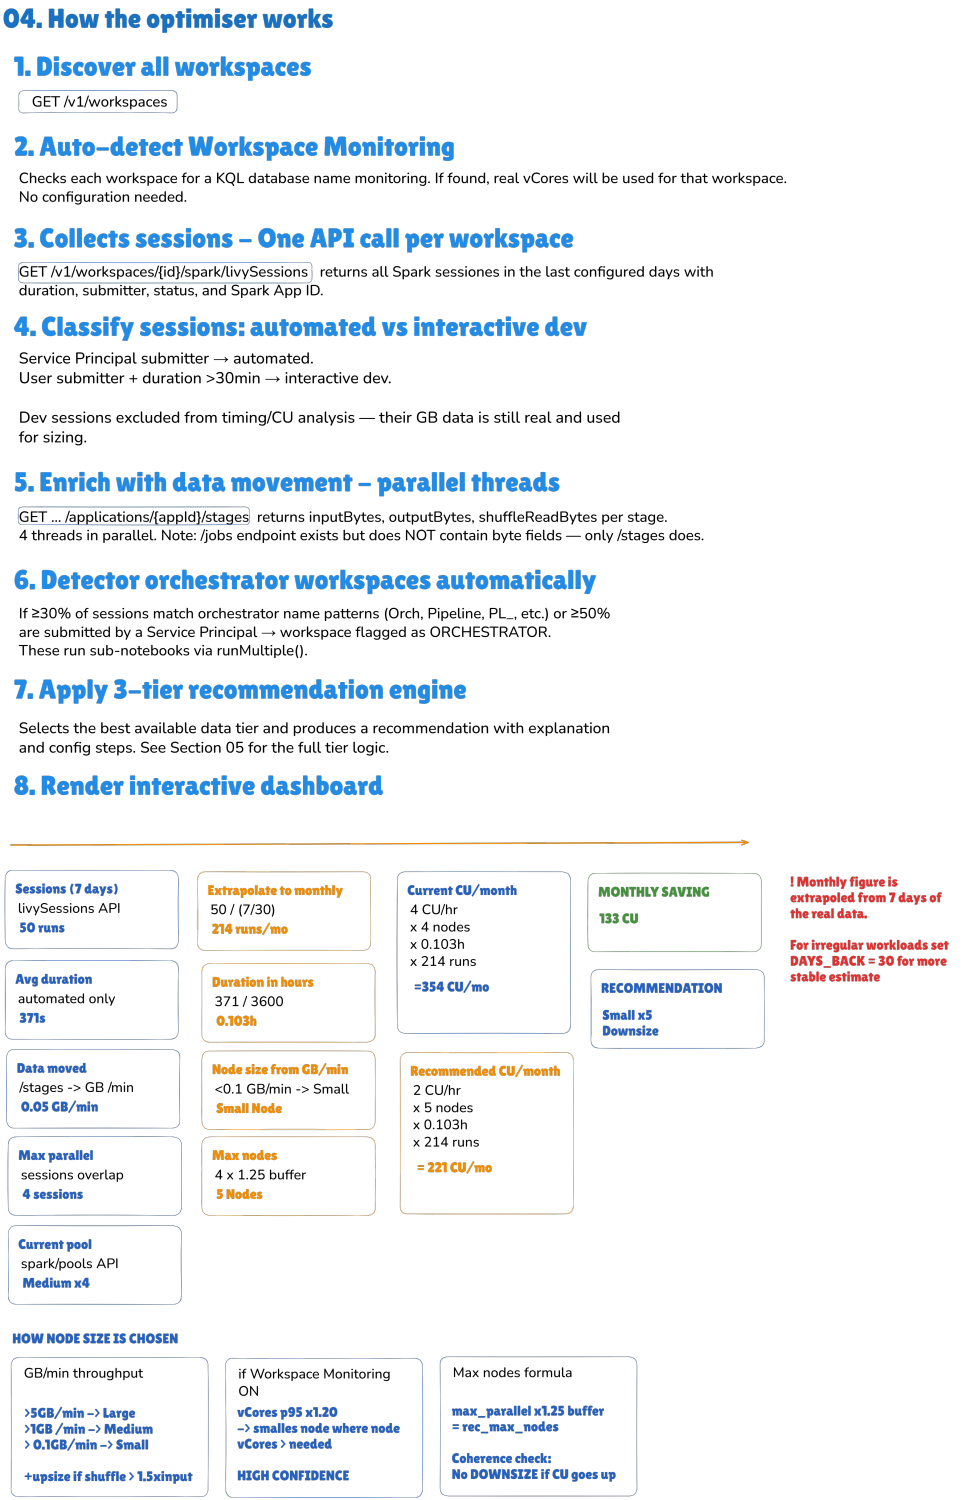
1. Discover all workspaces — GET /v1/workspaces.
2. Auto-detect Workspace Monitoring. Checks each workspace for a KQL database named monitoring. If found, real vCores will be used for that workspace. No configuration needed.
3. Collect sessions — one API call per workspace. GET /v1/workspaces/{id}/spark/livySessions returns all Spark sessions in the last configured days with duration, submitter, status, and Spark App ID.
4. Classify sessions: automated vs interactive dev. Service Principal submitter → automated. User submitter + duration > 30 min → interactive dev. Dev sessions are excluded from timing/CU analysis — their GB data is still real and used for sizing.
5. Enrich with data movement — parallel threads. GET .../applications/{appId}/stages returns inputBytes, outputBytes, and shuffleReadBytes per stage, fetched with 4 threads in parallel. Note: the /jobs endpoint exists but does NOT contain byte fields — only /stages does.
6. Detect orchestrator workspaces automatically. If ≥30% of sessions match orchestrator name patterns (Orch, Orchestrat, Pipeline, Daily_, PL_) or ≥50% are submitted by a Service Principal, the workspace is flagged as an ORCHESTRATOR — these run sub-notebooks via runMultiple().
7. Apply a 3-tier recommendation engine. Selects the best available data tier and produces a recommendation with an explanation and configuration steps.
8. Render the interactive dashboard.
A worked example from the dashboard: 50 sessions over 7 days extrapolate to 214 runs/month. At 371 seconds average duration (0.103h) on the current Medium × 4 pool, that’s 4 CU/hr × 4 nodes × 0.103h × 214 runs ≈ 354 CU/month. Data moved was only 0.05 GB/min — well under the 0.1 GB/min threshold for a Small node — and max parallel sessions never exceeded 4. The recommended configuration (2 CU/hr, 5 nodes, 0.103h, 214 runs) comes out to ≈ 221 CU/month: a Small × 5, downsized, saving roughly 133 CU/month on that single workspace.
How node size is chosen, from GB/min throughput: above 5 GB/min → Large, above 1 GB/min → Medium, above 0.1 GB/min → Small, with an upsize if shuffle > 1.5× input. If Workspace Monitoring is on, real vCore p95 × 1.20 picks the smallest node where available vCores exceed what’s needed — flagged as high confidence. Max nodes follows max_parallel × 1.25 buffer = recommended_max_nodes, with a coherence check: no downsize recommendation if CU would actually go up.
The takeaway
Most Fabric capacities are paying Medium × 4 rates for workloads that need a fraction of that — not because anyone decided it should be that way, but because nobody looked. The Optimiser doesn’t guess: it reads your actual Livy session history, classifies what’s automated versus what’s a developer thinking between cells, and turns that into a concrete downsize or upsize recommendation with the CU math shown.
If you’re running more than a couple of Fabric workspaces and haven’t touched the default Starter Pool since you created them, it’s worth the 10 minutes to find out what you’re actually paying for.
Have you run something like this against your own capacity? I’d be curious what you found oversized.
Enjoyed this?
Get new articles like this one straight to your inbox.