
15 Jun 2026 · Fabric Apps, Data Governance
Building a BI Data Catalog on Microsoft Fabric Apps (Rayfin) — a real use case
Who owns this report? We didn't know. So we built a governance catalog in a day.
Who owns this report? We didn’t know. So we built something.
There’s a question that comes up in almost every data team I’ve talked to, usually during a meeting where something doesn’t add up:
“Wait — who owns this report?”
Silence. Someone checks Teams. Someone else opens the Power BI service and looks for the workspace admin. Eventually someone says “I think it was Ana, but she left six months ago.”
That’s the moment you realise your data governance problem isn’t about tools or platforms. It’s about institutional knowledge living in the wrong places.
The problem we had
Many organizations today run mature data platforms on Microsoft Fabric. They have lakehouse architectures, semantic models, incremental refresh strategies, and row-level security policies in place. The technical foundation is often solid. However, metadata surrounding BI reports can remain scattered across different tools, documents, and teams, making it difficult for users to find, understand, and trust reporting assets.
Dozens of Power BI reports across Sales, Finance, Operations, Marketing. Each one built by someone, owned by someone, consuming data from somewhere. But none of that documented in a single place.
Common questions often went unanswered:
- Who owns this report?
- What business problem was it created to solve?
- Where does this metric originate?
- What assumptions or limitations should users be aware of?
- When was it last validated or reviewed?
These gaps highlighted the need for a BI Report Catalog — a centralized source of documentation for reporting assets. More than just technical metadata, it needed to capture business context, ownership, definitions, and governance information.
The goal was simple: make reports easier to discover, understand, maintain, and trust. A well-documented catalog can accelerate onboarding, reduce troubleshooting time, improve collaboration, and establish clear accountability.
Yet many organizations postpone initiatives like this. Not because the value is unclear, but because they are often perceived as large projects requiring extensive planning, custom development, databases, authentication, user interfaces, and dedicated implementation cycles. With competing priorities, documentation and governance improvements frequently remain on the backlog.
The trigger: Microsoft Build 2026
Two weeks ago, Microsoft announced Fabric Apps and Rayfin at Build 2026 — an open-source SDK and CLI that lets you define a complete application backend in TypeScript and deploy it to Microsoft Fabric in a single command.
The pitch: define your data models as TypeScript classes with decorators, and Fabric auto-generates the SQL schema, GraphQL API, and Microsoft Entra ID authentication. Your data lands in OneLake automatically — no ETL, no pipelines.
I’d been watching this space. And I thought: this is the moment to finally build the catalog.
So I opened VS Code, connected Claude Code as my pair programmer, and started.
What we built — in one day
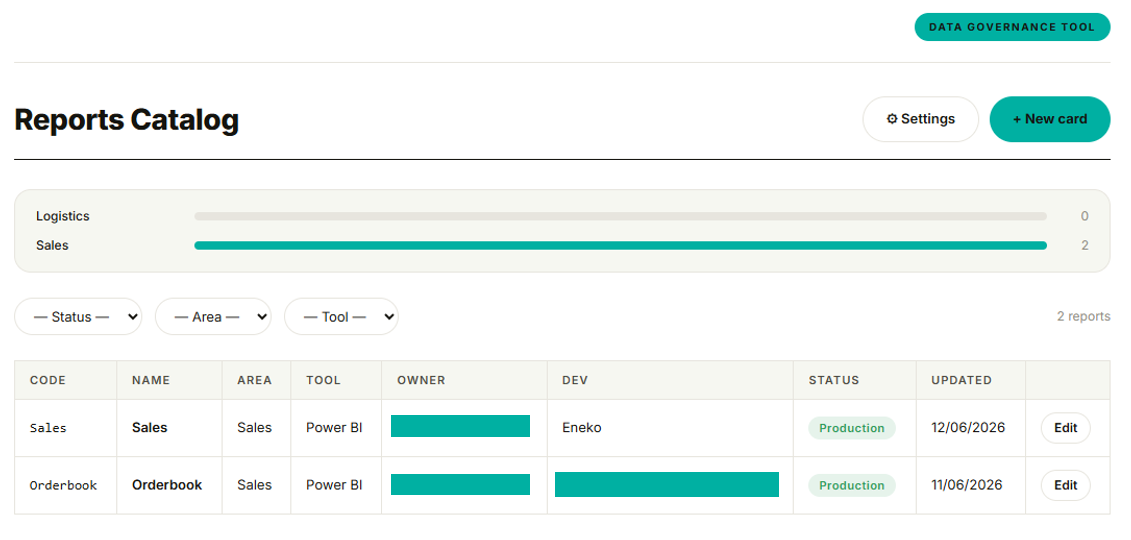
Reports Governance is a full web app deployed on Microsoft Fabric Apps where every BI report gets its own governance card with 12 sections:
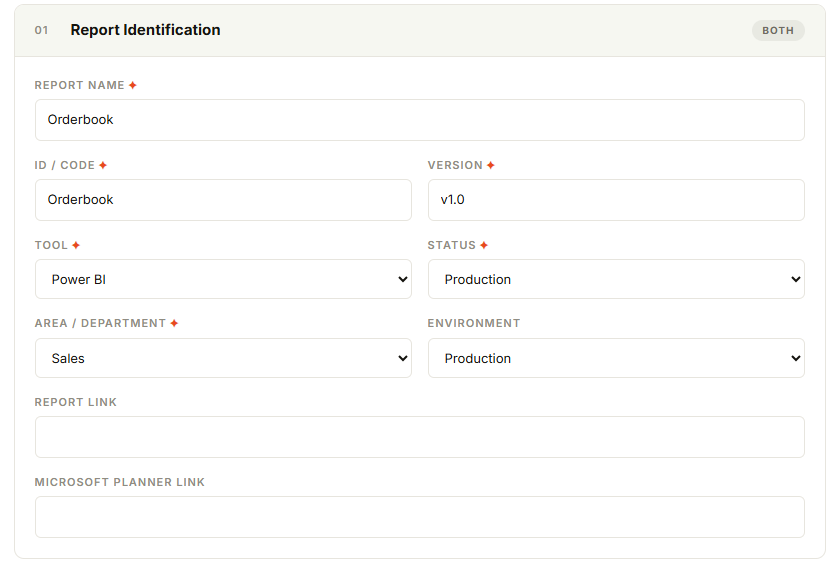
01 · Report Identification — name, code, version, tool, status, area, environment, and direct links to the report and the Planner backlog task.
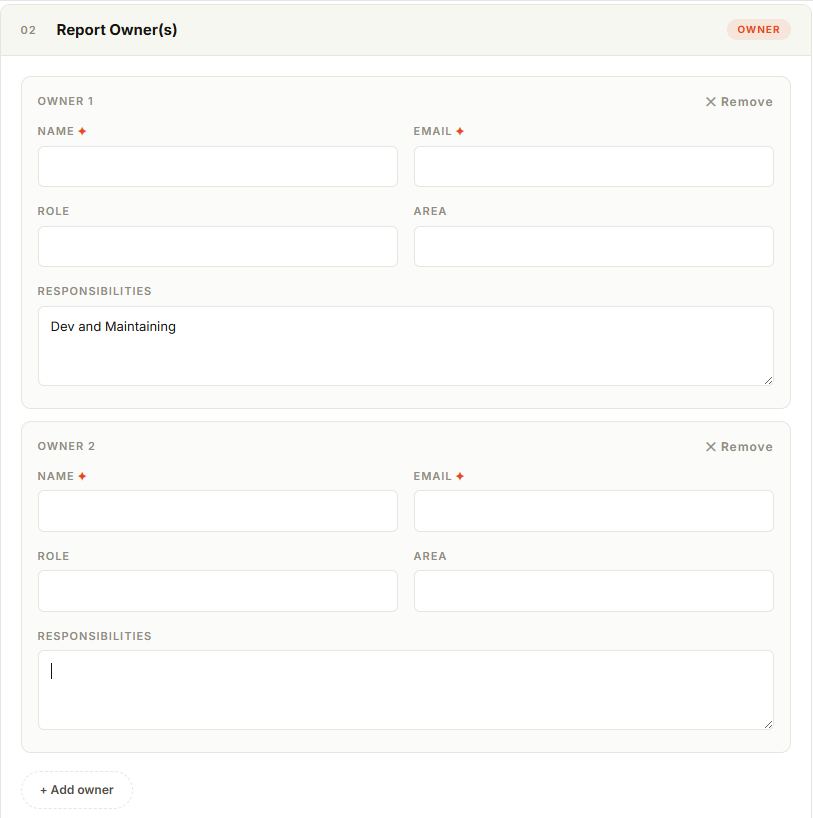
02 · Report Owner(s) — multiple owners supported, each with name, email, role, area, and responsibilities. Because in practice, reports often have more than one stakeholder.
03 · Developer — who built it, which team, where the code lives, and maintenance notes for whoever touches it next.
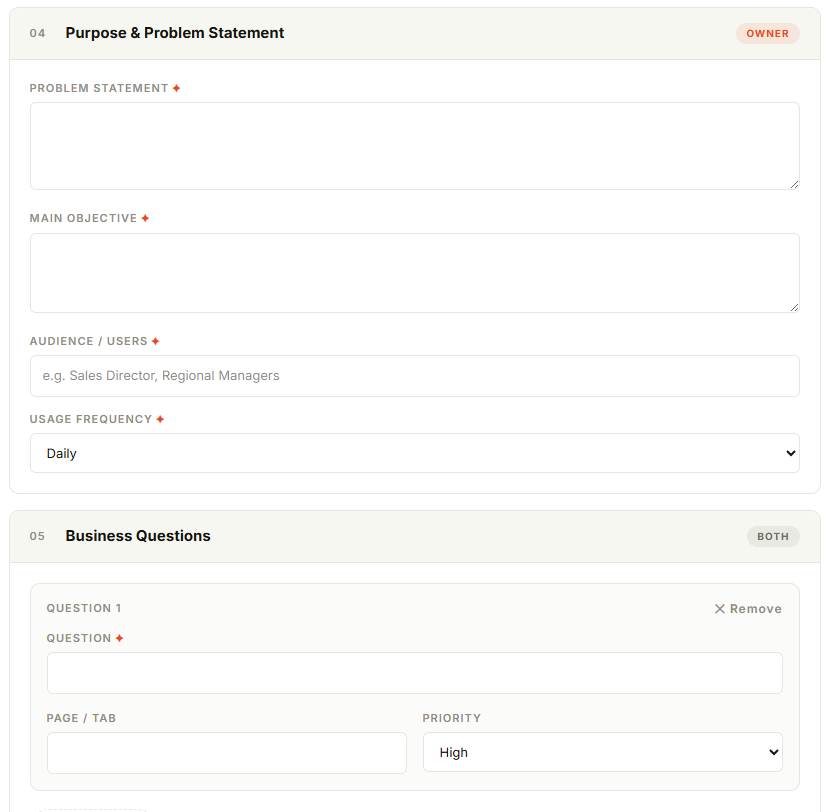
04 · Purpose & Problem Statement — the business problem it was created to solve, the main objective, the audience, and how frequently it’s used. Written in plain language, not technical language.
05 · Business Questions — the specific questions the report was designed to answer, with priority and the page where each one is addressed.
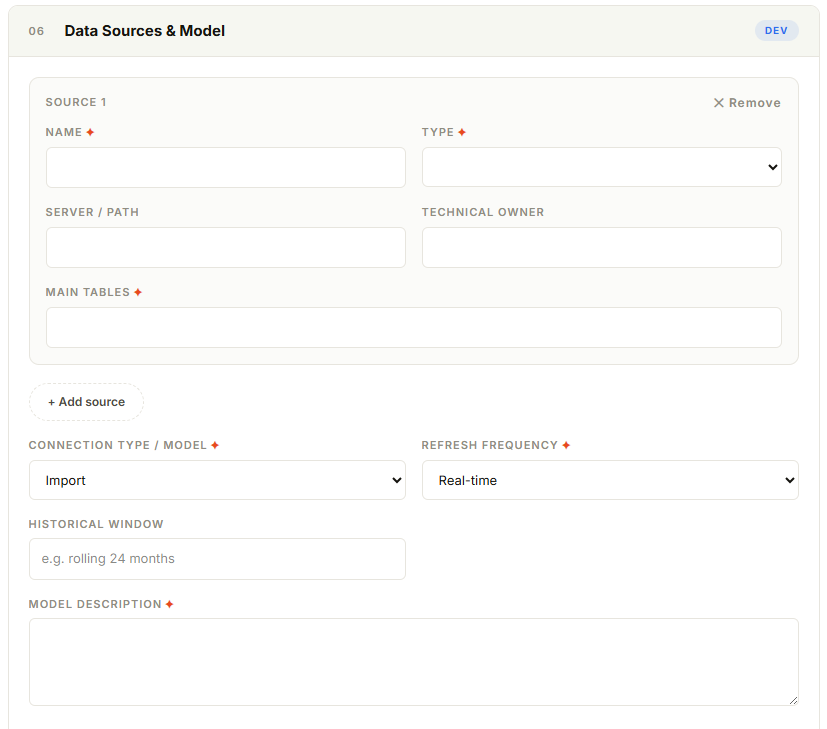
06 · Data Sources & Model — every source documented with type, server path, main tables, and the technical owner of that source. Plus connection type, refresh frequency, and model description.
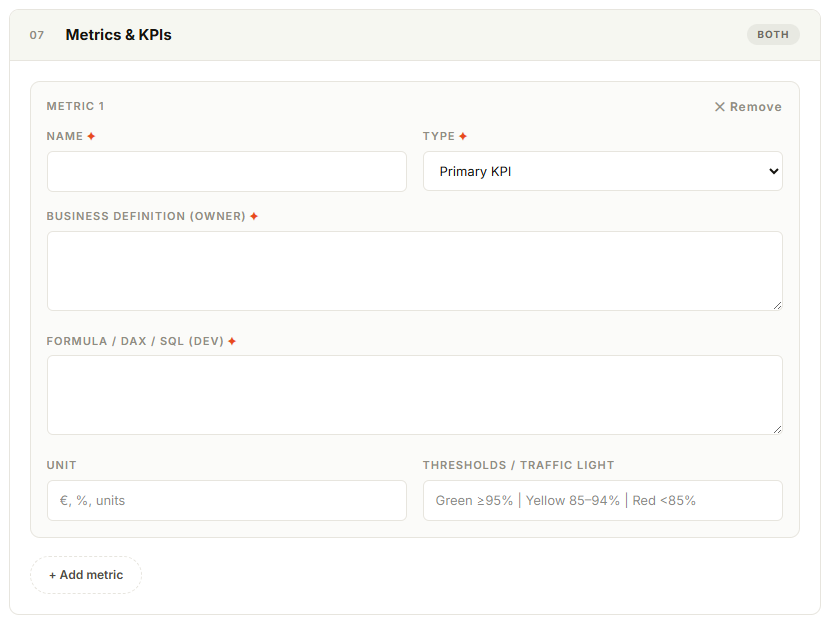
07 · Metrics & KPIs — this is the most collaborative section. The owner writes the business definition in plain language. The developer writes the DAX or SQL formula. Both live side by side. Traffic light thresholds included.
08 · Visualizations — each visual documented with what question it answers and what decision or action it enables. Forces the team to be explicit about why each chart exists.
09 · Filters & Interactions — available filters, default values, cross-visual interactions, and RLS rules. The kind of thing that lives in someone’s head until they leave the company.
10 · Data Quality & Limitations — known issues, quality alerts, and the golden source. Critical for anyone making decisions based on the report.
11 · Glossary — shared terms, reusable across cards. Build it once, reference it everywhere.
12 · Change Log — full history with author, version, type, and description. Every significant change leaves a trace.
And one practical feature that makes the governance loop actually close: automatic email notifications to owners when a card is published or updated. No more “I didn’t know that report changed.”
The technical architecture
The stack is straightforward:
- Microsoft Fabric Apps (Rayfin) — backend as a service. Seven TypeScript entity classes with
@entity()decorators generate the full SQL schema, GraphQL API, and Entra ID SSO automatically. - SQL Database in the Data governance dedicated workspace — the catalog data lands in OneLake immediately, queryable from Power BI without any pipeline.
- React + Vite + react-hook-form — frontend, deployed via Fabric’s static hosting.
- Claude Code — pair programming for the entire build, from data model design to deployment config.
- Confluence — each card is exportable as a Confluence page for teams that prefer documentation in wiki format.
- Microsoft Planner — bidirectional link between the governance card and the backlog task.
One command to deploy everything: npx rayfin up
What impressed me most about Rayfin is the translytical flow — the same SQL Database that handles the transactional writes from the app is immediately available as an analytics endpoint in OneLake. No copy, no sync, no ETL. The catalog data is just… there, ready for Power BI.
What’s next
The logical next step is a Power BI report connected directly to the catalog SQL Database. Governance visibility across the organization: which reports don’t have an owner, which data sources are most used, which reports haven’t been updated in months, coverage by department.
All of it powered by the data the team fills in the app — a governance feedback loop built on the same platform.
The real lesson
This isn’t really about Fabric Apps or Rayfin or even data governance tooling.
It’s about what becomes possible when the gap between “I have an idea” and “this is in production” collapses to a day.
Data teams have long lists of things that would clearly improve their ecosystem — better documentation, cleaner lineage, more explicit ownership. These things don’t get done not because they’re hard, but because the effort-to-value calculation always loses against the next urgent thing.
AI as a genuine coding partner changes that calculation. Not by doing magic — but by removing the friction that makes small-but-important projects feel like big ones.
The barrier isn’t technical anymore. It’s deciding to start.
Are you building internal data governance tooling, or exploring Fabric Apps for operational use cases? I’d love to exchange notes.
Enjoyed this?
Get new articles like this one straight to your inbox.